

Table of contents
Introduction
In this ERA of Tech, Data is present everywhere and it won't be wrong to say that we are surrounded by it. So what is this Data, actually I Believe it's not even your first time hearing this word. So let me simplify the term "Data" for you and then we will dive a little deeper into its types and its levels of measurement. Let's go...

What is Data?
Anything that can be recorded or used to convey info about an object can be termed as Data.
Info in the sense can be the object's quality, quantity, fact, statistics etc.
Data(Plural) , Datum(Singular)
Eg: The height of Students in a Class.
In the above scenario, height can be recorded/measured and it conveys "how tall or short" the students are, ie portraying more about their quantity.
Moving ahead, let's dive into the categories in which data is classified:
Data Types
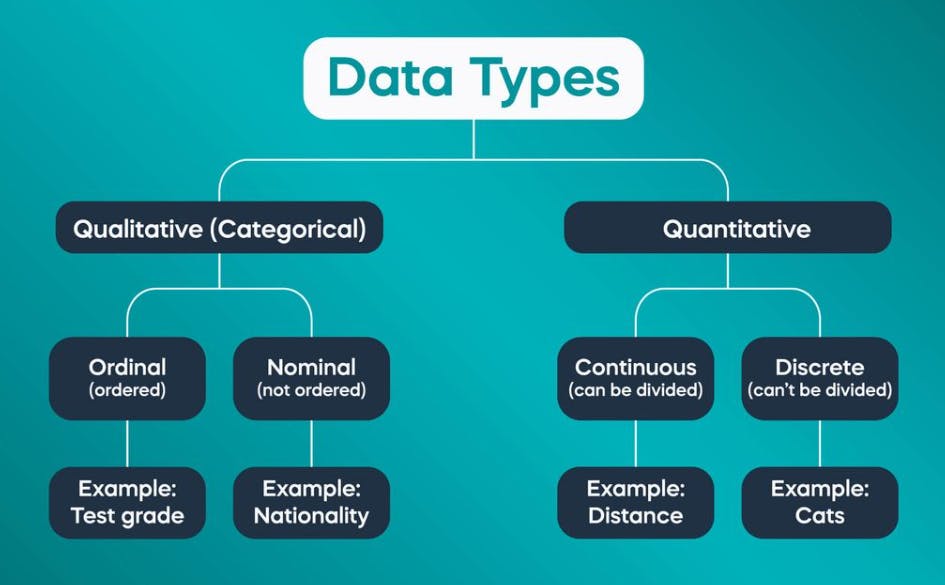
Data is broadly classified into two sub-divisions
A) Qualitative Data (Categorical)
B) Quantitative Data (Numerical)
A) Qualitative Data
As the name suggests, qualitative data describes the quality of an object or a group of items. It is also known as categorical data as it has defined categories for labelling an object or a group of items into it.
Eg: Grades, Eye Colour
Furthermore, Qualitative Data is again sub-divided into two, Nominal and Ordinal Data
a) Nominal Data
It's the simplest form of data. Here data is divided into different categories.
Eg: Eye colour (Brown, black, green), Marital Status (Married, unmarried).
b) Ordinal Data
Here data is also divided into categories but with ranking.
Ordinal Data = Nominal data + Ranking.
Eg: Student Grades (A, B, C, D, E) A-highest and E-lowest.
: App Rating (5, 4, 3, 2, 1) 5-very happy and 1-dissatisfied.
Moving on with

B) Quantitative Data
If Qualitative tells about the quality of data. You must have guessed what quantitative is all about. That's right! Quantitative data is all about quantities ie numeric values attached to a particular object or a group of objects.
Mathematical operations can be performed on Quantitative Data.
This division is also divided into two sub-divisions known as
a) Continuous Data
As the name suggests data present here is continuous, in broad aspects, the data here can be divided into smaller units further (contains point values also)
Eg: Weight (Can be divided into Kilograms, grams, and milligrams). The weight of a person can be 53.7 kg or 54.2 kg and that makes sense.
Other Eg: Height, Power etc.
b) Discrete Data
Here the data present is of fixed value/counted items ie the absence of division into smaller units (or points).
Eg: A Pack of Cards (contains only 52 cards - fixed value, not 51.4 cards or 51.01 cards)
Other Eg: No of students in a class.
Now the final part,
Levels of Data Measurement
To understand the levels of data measurement, one should first understand what a variable and measurement are -
Variable - In Real World, any entity capable of taking different values can be termed a variable. Eg: Height, Money, Time etc.
Measurement: It is the process of assigning numbers(values) to variables. Eg: For measuring time we use a stopwatch, which denotes time by moving its minutes and seconds hands or digitally by numbers.
The four levels of Data measurement of a variable from Lowest to Highest are Nominal, Ordinal, Interval and Ratio.
1) Nominal
The term "Nominal" comes from Latin which can be translated into "being so in the name only". As already mentioned in the above paragraphs, nominal divides data into categories without ranking.
You can use nominal data by assigning some value to it such as for colour. Eg: Red-1, Blue-2, Green-3 etc.
The only mathematical operation that can be performed on the nominal variable is Mode (the most frequent value).
2) Ordinal
The name "Ordinal", signifies the presence of an order. As already mentioned, it divides data into different categories with a ranking. Ranking here signifies the order of data.
Eg: Student Grades A-highest (value assigned-10) , E-lowest(value assigned-2)
The mathematical operations that can be performed here are Mode, and Median (middle value).
3) Interval
Interval is one level above ordinal data. With the order, it also gives an idea about the interval present between subsequent values of the data are same.
It can also be defined as an ordered scale where differences in the measurements are meaningful.
The interval data doesn't have a true zero point. Let me explain this with an example, Year (doesn't have 0, started from 1 AD), Temperature scales of Fahrenheit and Celsius don't have a true zero point scale on them.
The mathematical operations performed here include Mode, Median, and Mean(Average) along with addition and subtraction.
4) Ratio
The highest level of data measurement on the top of the interval is Ratio. The ratio is an ordered scale where the difference of measurements has a meaningful zero value.
Eg: Price, length, weight, Kelvin Scale in Temperature (absolute 0K).
The presence of a meaningful zero in ratio allows us to calculate ratios between two data points: We can say that 20 mangoes are twice as much as 10, or that 50kg is half as heavy as 100kg.
This was not the case for interval data: in the case of temperature measured in degrees Celsius, we cannot say 10 degrees is twice as warm as 5 degrees.
Ratios make no sense for scales without a meaningful zero.
The mathematical operation performed here include Mean, Median, and Mode along with all four basic arithmetic operations addition, subtraction, multiplication and division.
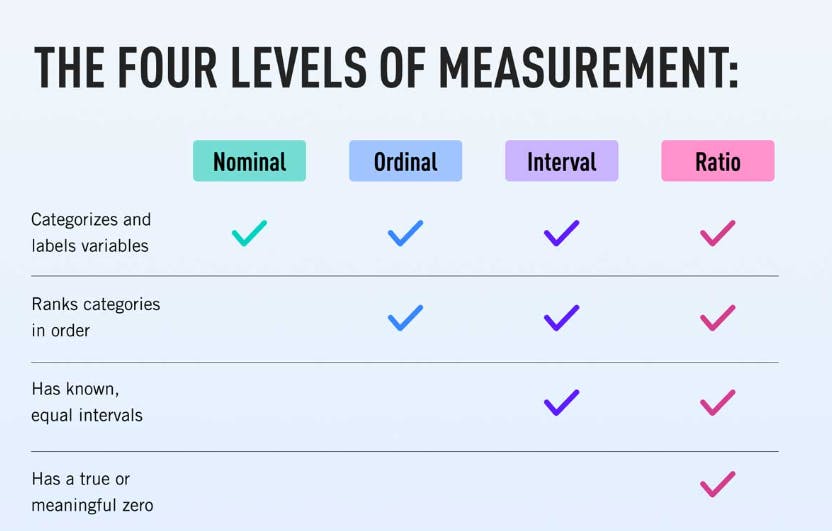
The above is a summary of what was discussed above.
I hope this blog helped you to understand data if you are a beginner in Data Science, Data Analytics or have a passion for Data and want to pursue this marvellous field in the future.
Thank You for Reading.
Stay Awesome, Stay Positive.
P.S. This is my first blog ever, and my first blog on Hashnode. Many more to come. The Journey has begun...